

Breaking Down a Covered Call Trade: WISH

Last newsletter, I explained why I think selling covered calls is the best long-term investing strategy for active investors. You can double or triple the cash yield of your portfolio without significantly capping your long-term growth, if you execute the strategy correctly.
Today, I’m going to break down a specific investment involving covered calls.
Remember, you should only use this strategy with stocks you feel comfortable holding over the long-term. Do not make the mistake of doing this with the highest IV (implied volatility) stocks just to maximize yield. AMC may have the highest IV, but you also could easily lose 50% of your capital if another selloff happens.
For this example, let’s say I own 500 shares of WISH. At today’s market price, that’s a market value of $4,865. Many believe that Wish is undervalued compared to other similar e-commerce companies.

In this example, I am going to be back-testing to see how well past trades might have done. Let’s say I bought my shares exactly 2 months ago, when the price was about the same as it is today.
Assume I bought the 500 shares at $9.29 and held for a couple weeks before selling calls.
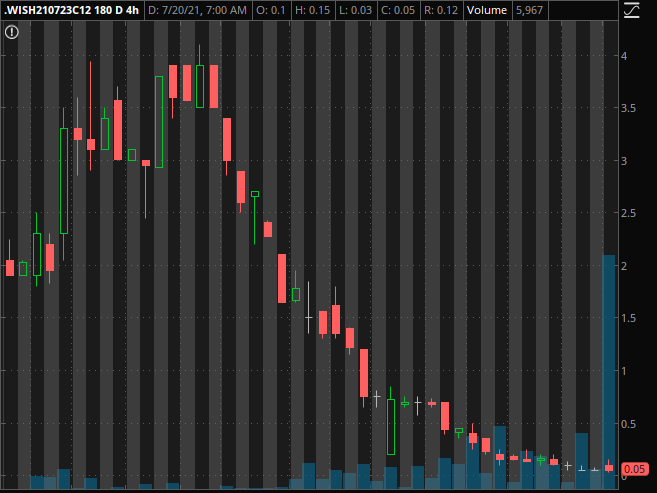
The end of June and beginning of July was a clear, massive IV top. Even at the time, it was clear that IV levels probably wouldn’t get much higher.
Say that I sold the July 23rd $12 calls around the beginning of July, at $1.56.
When back-testing, it’s important to assume that you would not have sold calls anywhere near the top. Timing the exact top is extremely rare, so I will assume that I sold calls about 60% lower than the top of $4.00.
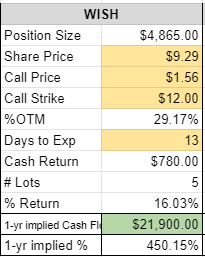
Assuming I sold 5 calls at $1.56, I would have netted $780. That’s a 16.03% return on my capital.
However, we have to remember that the 16% is not an immediate return. I need the call’s value to go down in order to actually realize the gain. Alternatively, I could wait until expiration to fully realize the gain. If Wish closes below $12 on the expiration date, I would full realize the gain. If it closed anywhere below $13.56 (strike price + amount received), I would make a profit.
I prefer to close out these covered calls as soon as possible. One of the biggest risks of this strategy is missing out on large, sudden gains. That’s why I don’t want to have covered calls open all the time.
Instead, I want to sell calls as IV is spiking, then buy the calls back for much cheaper a day or two later after the mania fades away. Ideally, I make a profit on the calls quickly, and then the stock spikes up again later when my gains are not restricted by covered calls.

The last line of the spreadsheet tells me that my 1-year implied return is 450%. Obviously we wouldn’t be able to replicate this over an entire year. The IV spike that made the 16% return possible was very rare. For a solid covered call stock, I would usually expect a 1 to 2% monthly yield, with the risk of occasionally having my shares called away.
How do I find high IV Stocks?
I use Vig to find high IV stocks. They have a scanner that shows me call and put options with high IV.
They split it up into “code yellow” and “code red”, which is really helpful because code red contains stocks with astronomical IVs that you don’t want to hold long-term. I use the code yellow to find stocks with high, yet reasonable, IV levels. It’s a much better starting point to find long-term holds.

Here is a link to their 7-day free trial: https://vigtec.io/cn/wos
Disclaimer: I am friends with the Vig team and receive an affiliate commission if you end up paying for their service after the free trial.